
The difference between a shrinkage management system and a CCTV system
With the introduction of a seven-day trade week and the number of line items carried by a retail outlet, more and more retailers find themselves incapable of measuring and understanding what level of shrinkage exists. Old hands-on methods of measurement such as stock takes are now impossible to perform causing retailers to make decisions on theoretical shrinkage values, not understanding where their major shrinkage areas are.
It is with these challenges in mind that RBI launched its shrinkage management systems (SMS) in 2006. Many retailers are still unsure what the differences are between shrinkage management systems and a normal CCTV system with text overlay. According to Jan Schoeman, RBI's technical director, the situation is sometimes worsened where standard CCTV systems, whether based on a DVR or IP solution, are purchased at an astronomical cost, just to become another white elephant that nobody uses.
The intention of this article is therefore to highlight the differences between a shrinkage management system and a standard CCTV system with text overlay. It will inevitably allow the retailer to identify white elephants before the purchase decision is taken, which will ensure the required return on investment (ROI) that the retailer had in mind.
So what is the difference then? An SMS is capable of analysing, measuring, tracking and reporting shrinkage within a retail environment where a CCTV system merely records video footage with a POS overlay or POS integration. This means that an SMS consists of specialised technology capable of supplying outputs and reports that identify shrinkage points within a retail outlet, it has specific rules that apply to each retail environment and these rules differ from one type of retail environment to the next (ie, FMCG, clothing, forecourts, building suppliers etc).
Further to the definition as being a system; a SMS also requires services such as video auditing of each transaction performed by a primary retail unit as well as SOP changes. It is only through this integrated approach of technology, services and SOP changes that a secondary system is created that is capable of measuring, adapting and combating the intuitive methods personnel find to pilfer within a retail environment.
Identifying shrinkage points
Within an ideal world and within a zero shrinkage environment all goods received will end up on the retail floor after which they would be sold at the ideal margin, and all moneys will end up in the retailer's bank account. This is, however, not what happens. The retailer inevitably ends up with shrinkage at goods receiving, somewhere between goods receiving and the retail floor, at the POS consoles, the scales and the cash office.
To add to the woes of the retailer the sheer magnitude of transactions taking place and the number of goods moving to the retail area inevitably require an automated measurement of transactions. This definition leads us to a conclusion that a secondary system is needed that runs concurrently with primary retail systems and measure the throughput through these systems ie, a system that integrates with all primary retail systems at a raw data level and is capable of analysing data captured, make intelligent decisions and let the retailer know if out of the ordinary things happen. A graphical representation of primary retail systems and integration points are depicted in Figure 1.
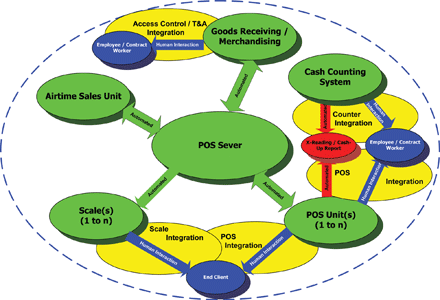
Although Figure 1 applies to an FMCG outlet, the integration points can be applied in the same manner to any other retail outlet. In its most basic form there are only two ways to pilfer from a point-of-sale or scale that forms part of a retail outlet's primary retail systems. The first method is to not ring-up or weigh an item and the second is to ring-up or weigh a cheaper item, both methods better known as 'sweethearting' have numerous variants within the market place but still remain a derivative of these two methods.
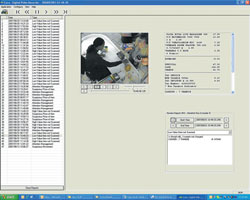
In order to combat 'sweethearting' we require specific technology called a shrinkage management platform explained further in this document and a video auditing service. The video auditing service consists of video auditors that review each and every transaction performed at a specific POS console or scale. The technology should not only supply an integration between the POS console or scale that is placed next to the video but should also determine through intelligence which scale or POS console should be video audited. The output of this service as depicted by Figure 2 is a CD or DVD with only the incidents where cashiers or scale operators were found to pilfer.
So what should the technology supply?
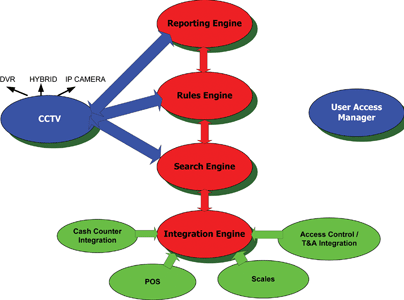
In order for the technology to be called a shrinkage management platform (SMP), it should in its most basic form consist of four end user components namely an integration engine, search engine, rules engine and reporting engine as depicted in Figure 3.
The integration engine allows for the integration of the cash counting machine, the POS consoles, scales and access control and time and attendance systems. As is clearly illustrated CCTV is accessible from all components making it possible to retrieve video footage for any transaction performed by any of the primary retail system units or sub system integration points. Note that the CCTV is not a primary component of the shrinkage management platform but merely a vehicle to retrieve video footage of a transaction. The CCTV system could be either a DVR (receives feeds from analogue cameras and digitises it before recording to a hard drive of a computer), a hybrid system (allows for both analogue and IP cameras) or an IP camera solution. Of these the most cost effective to supply the required video footage is a hybrid system and should be the minimal specification to ensure that the platform will be able to interface with cameras in the future.
The search engine allows for easy retrieval of video material and operates the same as a search engine on the Internet. Ensure that queries such as show me all the video where Joe Soap was weighing soup bones or Mary the cashier has sold soup bones is possible. The integration of Time and Attendance should allow for queries such as show me all video footage that merchandiser Tom has been in the store and when he left.
The rules engine is where all the intelligence of the system is built into. The rules engine's primary task is to analyse and measure what merchandise has been sold or weighed. It determines which cashiers were not performing in a day ie, their basket value is much lower than other cashiers, when too much of an item was sold or whether a cashier has sold too many of a specific low-cost item compared to other cashiers. It is within this module where the major differences exist between a CCTV system and a shrinkage management platform. CCTV systems allow only for the retrieval of video footage at the POS unit. Management platforms are capable of measuring and learning when things are out of the ordinary. The output of this module not only becomes the basis of the video auditing service and allows for a scientific approach to managing the shrinkage within the retail outlet but also raises exceptions on a daily basis ensuring timely relevant and effective information that enables the retailer to manage his environment in a proactive manner.
The final component is the reporting engine, which consist of four tiers of reports. Tier 1 typically displays search engine results. It should be able to be configured by the end-user to search for any item, any number whether this is a credit card, transaction number, cheque number or cashier/operator or any combination of the above. This report is specifically aimed to shorten the time period spend when investigating specific incidents that are re-occurring.
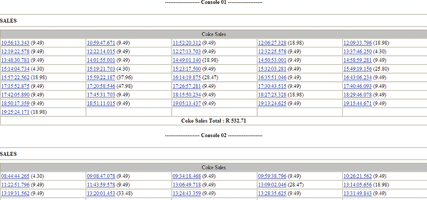
Tier 2 data consists of an evaluation of cashiers and operators as a group. The reports therefore compare the performance of cashiers and operators to that of the retail outlet as a whole. Each line item sold is recorded and compared to the store average making it possible to identify trends in shrinkage on a daily basis. Figure 4 illustrates a typical Tier 2 report where line items are compared between cashiers and the store average. The intention is to identify when low value items are used to pilfer from the point-of-sale.
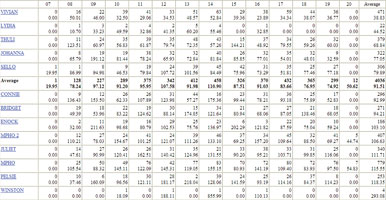
Tier 3 data displays rules engine results and is therefore mostly used within the retail outlet and by the retailer. It only reports exceptions to rules made by the retailer and the system, making it possible for the retailer to identify problem areas without getting caught up in the vast amount of information logged by the system in a day. Each cashier or scale operator earmarked for video auditing together with reasons why they were identified are supplied on a single page document on a daily basis. This report can be configured to be printed automatically or on request. Figure 5 depicts part of a typical rules report. The cashiers identified for the video auditing service were Vivian and Thuli. Both cashiers' Average Basket Values were way below the store average. As can be seen the report divides the day in hours and cashiers are compared per hour due to the different shopping habits of clients within this retail sector. There was also a phantom cashier identified named Winston that only did four transactions on this day with a total value of close to R300.
Tier 4 data report is aimed at group and corporate level reporting. It is developed specific for a group or corporate and depends on the specific information that a group or corporate risk manager requires on a daily basis. Each store is analysed against other stores depicting typical data such as average basket value, top items sold, the cashiers and scale operators that were selected to be video audited and why, the evaluation of labour costs as a comparison to other stores in the group etc.
For details contact RBI, +27 (0)12 342 1480, [email protected], www.rbi-sa.co.za

© Technews Publishing (Pty) Ltd. | All Rights Reserved.